Multi-EMA IndicatorIndicator Purpose
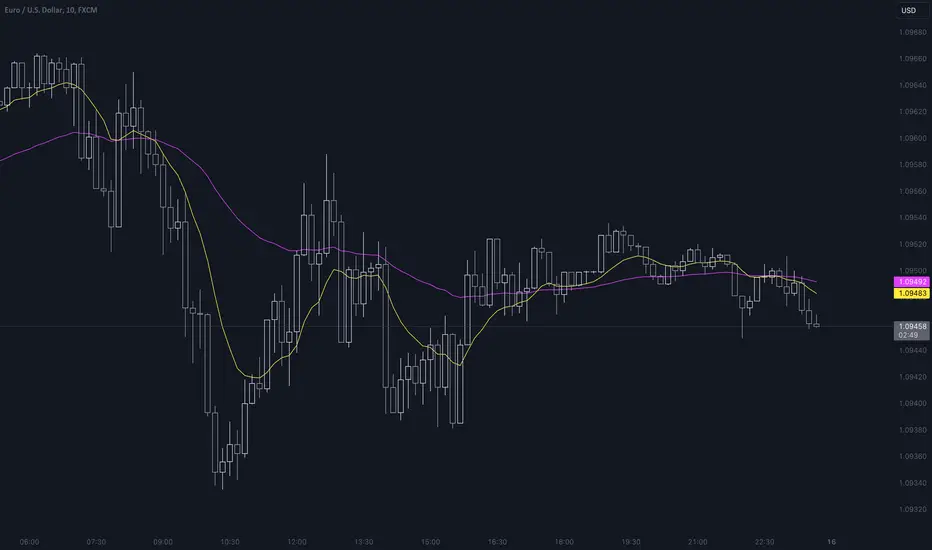
The "Multi EMA Indicator" is a clean, customizable script that plots up to four Exponential Moving Averages (EMAs) on the price chart simultaneously. It is designed for traders who want full control over which EMAs are displayed, their periods, colors, and visibility — without cluttering the chart or needing multiple separate EMA indicators.
User-Configurable Options (all adjustable from the indicator’s settings panel):Option
All EMAs are calculated using the close price and are plotted with a linewidth of 2 for clear visibility. Users can instantly show/hide any combination of the four EMAs and change their colors to match any charting style or strategy (e.g., 9/21 crossover, 50/200 golden cross, etc.).
Wyszukaj w skryptach "3 ema"

Triangle Breakout Strategy with TP/SL, EMA Filter📌 Triangle Breakout Strategy with TP/SL, EMA Filters, and Backtest – Explained.
✅ 1. Pattern Detection – Triangle Breakout
The script scans for triangle patterns by detecting local pivot highs and pivot lows.
It uses two recent highs and two recent lows to draw converging trendlines (upper and lower boundaries of the triangle).
If the price breaks above the upper trendline, a bullish breakout signal is generated.
🎯 2. TP (Take Profit) & SL (Stop Loss)
When a bullish breakout is detected:
A buy order is placed using strategy.entry.
TP and SL levels are calculated relative to the current close price:
TP = 3% above the entry price
SL = 1.5% below the entry price
These are defined using strategy.exit.
📊 3. EMA Filter
An optional filter checks if:
Price is above both EMA 20 and EMA 50
Only if this condition is met, the strategy allows a long entry.
You can toggle the filter on or off with useEMAFilter.
📈 4. Backtesting with Strategy Tester
This script uses strategy() instead of indicator() to enable TradingView’s built-in backtest engine.
Every buy entry and exit (based on TP or SL) is recorded.
📌 5. Visuals
EMA 20 and EMA 50 lines are plotted on the chart.
A label is shown when a breakout is detected: "Breakout Up"
Results (profit, win rate, drawdown, etc.) can be viewed in the Strategy Tester panel.

UM VIX status table and Roll Yield with EMA
Description :
This oscillator indicator gives you a quick snapshot of VIX, VIX futures prices, and the related VIX roll yield at a glance. When the roll yield is greater than 0, The front-month VX1 future contract is less than the next-month VX2 contract. This is called Contango and is typical for the majority of the time. If the roll yield falls below zero. This is considered backwardation where the front-month VX1 contract is higher than the value of the next-month VX2 contract. Contango is most common. When Backwardation occurs, there is usually high volatility present.
Features :
The red and green fill indicate the current roll yield with the gray line being zero.
An Exponential moving average is overlaid on the roll yield. It is red when trending down and green when trending up. If you right-click the indicator, you can set alerts for roll yield EMA color transitions green to red or red to green.
Suggested uses:
The author suggests a one hour chart using the 55 period EMA with a 60 minute setting in the indicator. This gives you a visual idea of whether the roll yield is rising or falling. The roll yield will often change directions at market turning points. For example if the roll yield EMA changes from red to green, this indicates a rising roll yield and volatility is subsiding. This could be considered bullish. If the roll yield begins falling, this indicates volatility is rising. This may be negative for stocks and indexes.
I look for short volatility positions (SVIX) when the roll yield is rising. I look for long volatility positions (VXX, UVXY, UVIX) when the roll yield begins falling. The indicator can be added to any chart. I suggest using the VX1, SPY, VIX, or other major stock index.
Set the time frame to your trading style. The default is 60 minutes. Note, the timeframe of the indicator does NOT utilize the current chart timeframe, it must be set to the desired timeframe. I manually input text on the chart indicator for understanding periods of Long and Short Volatility.
Settings and Defaults
The EMA is set to 55 by default and the table location is set to the lower right. The default time frame is 60 minutes. These features are all user configurable.
Other considerations
Sometimes the Tradingview data when a VX contract expires and another contract begins, may not transition cleanly and appear as a break on the chart. Tradingview is working on this as stated from my last request. This VX contract from one expiring contract to the next can be fixed on the price chart manually: ( Chart settings, Symbol, check the "Adjust for contract changes" box)
Observations
Pull up a one-hour chart of VX1 or SPY. Add this indicator. roll it back in time to see how the market and volatility reacts when the EMA changes from red to green and green to red. Adjust the EMA to your trading style and time frame. Use this for added confirmation of your long and short volatility trades with the Volatility ETFs SVIX, SVXY, VXX, UVXY, UVIX. or use it for long/short indexes such as SPY.

EMA + Lower Timeframe EMA (correct display in Replay Mode)This indicator shows
one EMA for the current timeframe
one EMA for a lower timeframe
Unlike the built-in Tradingview EMA indicator, this indicator shows the correct values for the lower timeframe EMA during Replay Mode.
Fibonacci EMA's with Bollinger Bands [Feniks]Many Fibonacci EMAs are calculated and then tracked using custom-colored candlesticks so that your chart remains very clean. This setup is mainly used for scalping on the 2min. Feniks uses gray candlesticks and then all of the custom-colored candlesticks to know when to react to price action.
WARNING: Do your own due diligence and try it out. Also, the script's default colors were determined with the chart's candlesticks being gray for both bullish/bearish candles. You'll probably have to change some of the colors to make use of the script if your chart's candlesticks are not similarly configured.
The main two strategies involve the 13/55 and 21/233.
The 13 EMA (blue) crosses above or below the 55 EMA (green).
- 13/55 Crossover is shown by the triggering candlestick being blue.
- 55/13 Crossunder is shown by the triggering candlestick being orange.
- (Alerts 1/2)
The 21 EMA (red) crosses above or below the 233 EMA (white).
- 21/233 Crossover is shown by the triggering candlestick being green.
- 233/21 Crossunder is shown by the triggering candlestick being red.
- (Alerts 3/4)
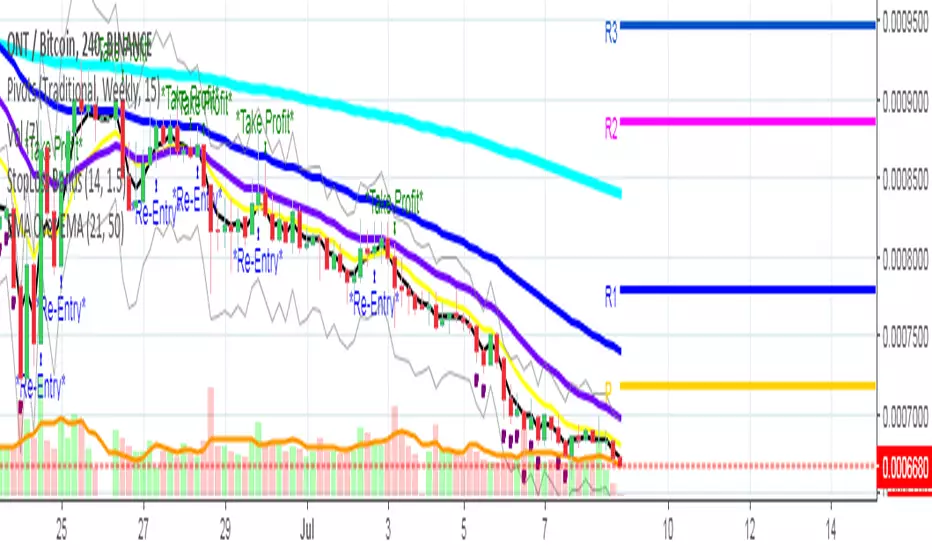
Tipsy EMA Tipsy EMA
v0.2a
Coded by vaidab.
A simple strategy to buy dips in an uptrend.
How to use:
- buy on trend when price retraces to the orange "buy" line and compound orders
- sell when price reaches red line (stop loss) or at 💰 (take profit)
Note that you can reverse trade on the 💰 sign for a short scalp / day trade.
Uptrend: green/red background. Danger zone: orange bg. No go zone: no bg.
Potential buys (in a clear trend): 55, 100, 200 EMA touches and
fibo retracements to .382 and .618.
Potential stop loss: when price breaks the 200 EMA (marked by a red line).
Exit signs: opposite trend divergences (RSI).
Take profit: EMA 55 crossing down EMA 100.
Use it in confluence with market structure. E.g. If 200 EMA ligns up with
past market structure, if there are whole numbers or if there's a monthly level.
Tested BTCUSDT D, 4H

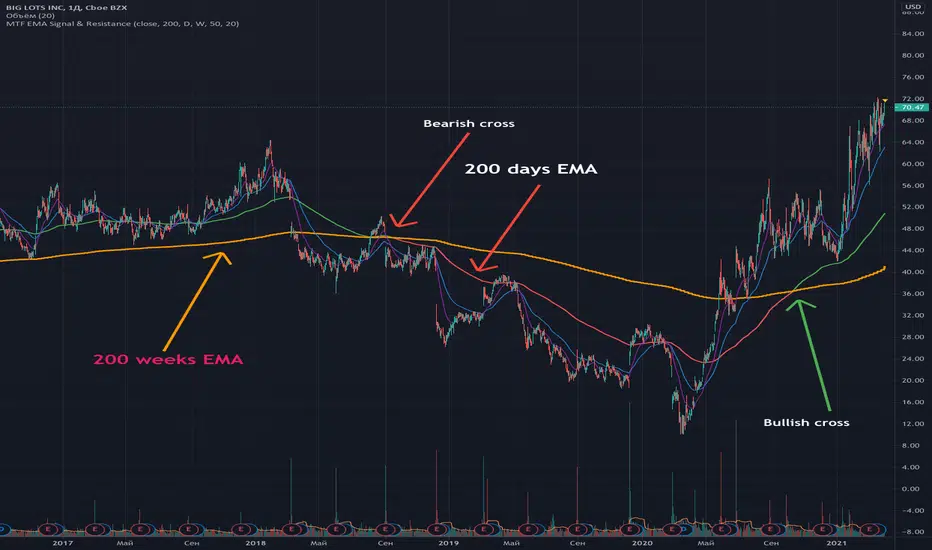
Multi Time Frame EMA Signal & ResistanceFull code and description: github.com/samgozman/MTF-EMA-Signal-and-Resistance
The idea of this script is quite simple. Imagine that you have a 200-day EMA and its support or resistance line is the 200-week EMA.
Then if EMA 200 1D > EMA 200 1W then the trend is bullish.
That is, EMA 200 1D is the signal line, and EMA 200 1W is the resistance.
Of course, you can independently set the time interval for the signal line and resistance, as well as the number of periods.
In addition to setting time intervals and period lengths, you can optionally enable the display of additional class EMAs.
You can also set the timeframe for the signal line equal to the current time period.
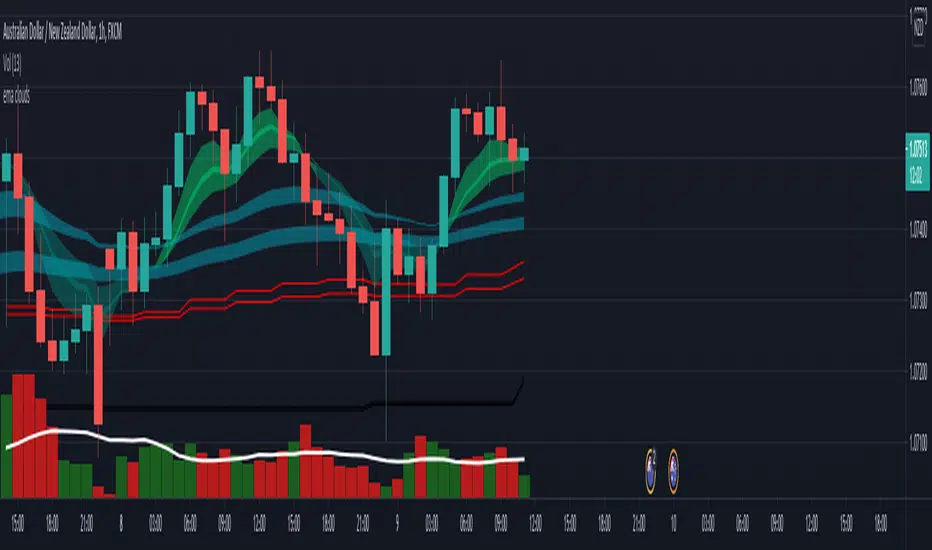
EMA cloudsCredits to Ripster47
5-12 ema cloud
34-50 ema cloud
72-89 ema cloud
1H is actually very important on swings + Daily/Weekly Level
5-12 EMA clouds on 1H Tell Trend
34-50 EMA clouds on 1H act as Dynamic Trendlines
72-89 EMA clouds on 3min acts as Dynamic Trendlines
EMA 5/10/21 SMA 50/100/200The Script is mixture of both EMAs and SMAs. EMA 5/10/21 are powerful indicators for short term providing more weightage to the recent prices. SMA 50/100/200 provide the long term view.
5 Day EMA: This is a sign of strong momentum. It tracks the trend in the short term time frame. This is support in the strongest up trends. This line can only be used in low volatility trends with strong momentum. A break back above this line is a sign for me that an uptrend may be resuming. I primarily use it as an end of day trailing stop. It is rare that this line does not break intraday, even in the strongest trending markets.
• 10 day EMA: The 10 day EMA is a great moving average to use to keep you on the right side of the major market trend. It is usually the first line to be lost before any real trouble begins. It can be used as a standalone signal in some stocks and markets that tend to trend strongly in one direction for long periods.
• 21 day EMA: This is the intermediate term moving average. It is generally the last line of support in a volatile uptrend. To me, it is the inevitable reversion to the mean in a market when it finally pulls back after an extended trend.
• 50 day SMA: This is the line that strong leading stocks typically pull back to. This is usually the support level for strong uptrends. It is normal for uptrending markets to pull back to this line and find support. Most bull markets and uptrends will pull back to this level. It is generally a great “Buy the dip” level.
• 100 day SMA: This is the line that provides the support between the 50 day and the 200 day. If it does not hold as support, there is a high probability that the 200 day SMA is the next stop. This is the deeper pullback level in bull markets and uptrends. It usually presents a great risk/reward ratio in bull markets.
• 200 day SMA: Bulls like to buy dips when markets are trading above the 200 day moving average, while bears sell rallies short below it. Bears usually win below this line, as the 200 day becomes longer term resistance, and bulls buy pullbacks to the 200 day as long as the price stays above it. This line is one of the biggest signals in the market telling you which side to be on. Bull above, Bear below. Bad things happen to stocks and markets when this line is lost.

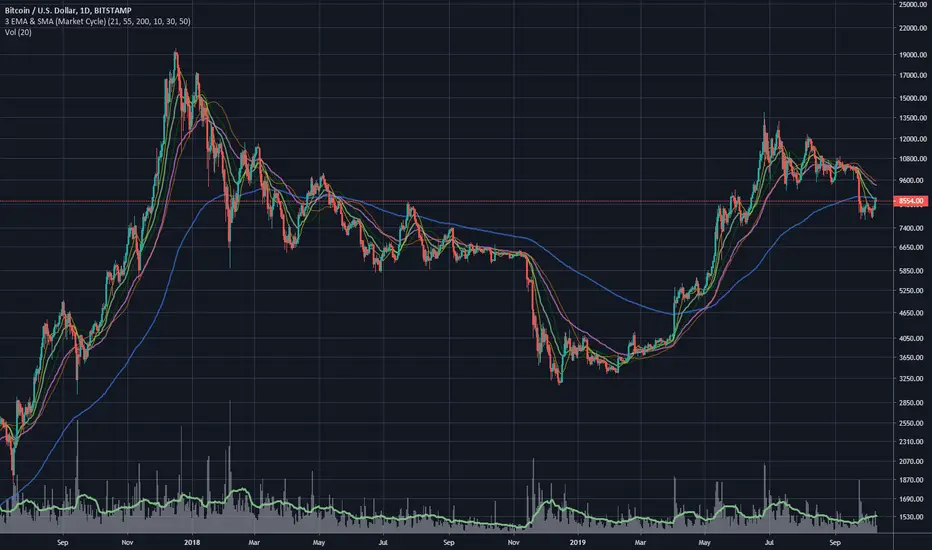
3 EMA & SMA (Market Cycle)Simple Indicator based on 3 Simple and 3 Exponential Moving Averages. Used to indicate Market Cycles.
Definition of Bull Market: 10 SMA is above 21 EMA . 30 SMA slope is up. 55 EMA is trending above 200 EMA .
Definition of Bear Market: 10 SMA is below 21 EMA . 30 SMA slope is down. 55 EMA is trending below 200 EMA .
EMA Cross EMA 21 50This script marks trending analisys when EMA 21 crosses EMA 50 in order to stablish a bullish or bearish trend. Also shows entry and quit points depending of EMA 3 crosses EMA 9.
EMA 200 is showed in order to take a better analisys of in or out
Also when RSI is down 30 level a purple flag is showed and an orange flag when 80 level is crossed up
This script works better in 4 hrs period
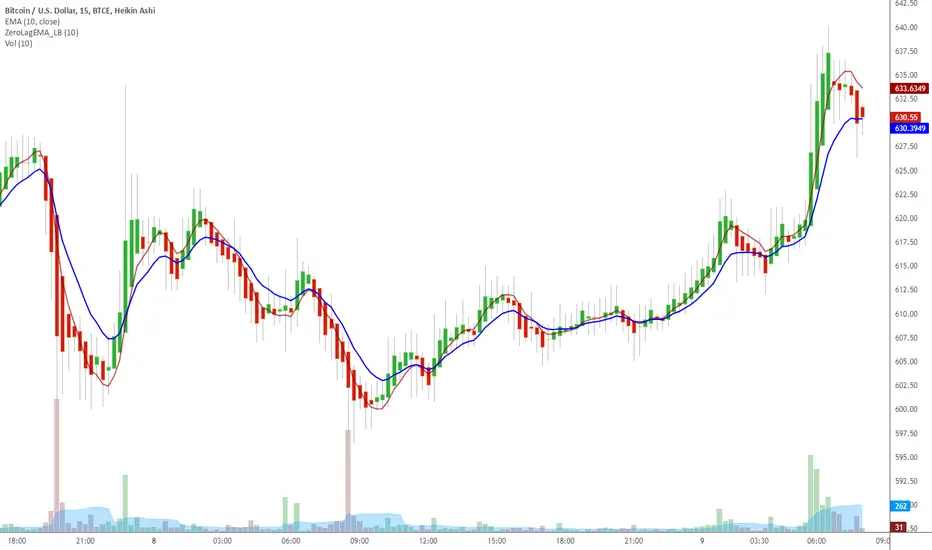
Indicator: Zero Lag EMA & a simple trading strategyZerolag (almost) EMA gives a good indicator of "close" trend. Many are familiar with the fast/slow ema crossing strategy. Try using this zerolag_ema as the fast runner. You will see improved and more reliable crossovers..
In general, when the zero_lag ema is above the EMA the instrument is in a bull mode and when the zero_lag ema is below the EMA the stock is bearish.
More info at www.mesasoftware.com
[davidev] EMA/MA with projection# EMA/MA with projection
## What it is
A lightweight overlay that plots up to three EMAs and one MA (default: 5/21/55 EMAs and 200 MA) and draws a forward projection from the current bar. The projection extrapolates the latest per-bar change (slope) to visualize where each average *could* be in the next N bars—useful for planning entries, dynamic support/resistance, and anticipating crossovers.
Note: The projection is a simple linear extrapolation of the most recent change. It is not a prediction or signal.
## How it works
Computes EMA1, EMA2, EMA3 and MA (SMA) on your chosen sources.
On the last bar only, it draws a short line segment ahead by `Bars Ahead`, using the most recent change (`ta.change()`) × number of bars to project the line.
Lines are **reused** and updated each tick (no clutter), and deleted on historical bars to avoid artifacts.
## Good for
Visualizing **dynamic levels** slightly ahead of price.
Quickly gauging **momentum** and **slope** of your moving averages.
Sketching possible **crossover timing** (e.g., 5 vs 21 EMA) without changing timeframe.
Cleaner charting: projection only renders on the last bar, so historical candles stay uncluttered.
## Tips
Combine with your market structure/volume tools; the projection helps **plan**, not predict.
Shorter EMAs react faster and will show more pronounced projected moves; longer MAs remain steadier.
Increase `Bars Ahead` on higher timeframes; keep it small on scalping charts to avoid overreach.

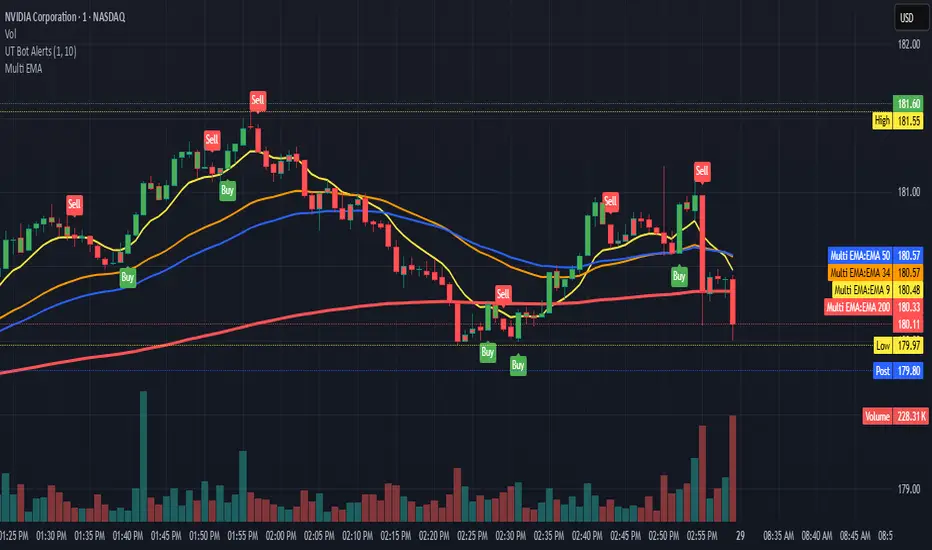
Multi-EMA System (9,34,50,200)This script gives you:
Yellow line: 9 EMA (your fastest momentum indicator)
Orange line: 34 EMA (good for short-term trend confirmation)
Blue line: 50 EMA (classic medium-term trend line)
Red line: 200 EMA (the big daddy - long-term trend and major support/resistance)
I made the 200 EMA a bit thicker since it's usually the most significant level. You can adjust the colors in the script if you prefer different ones.
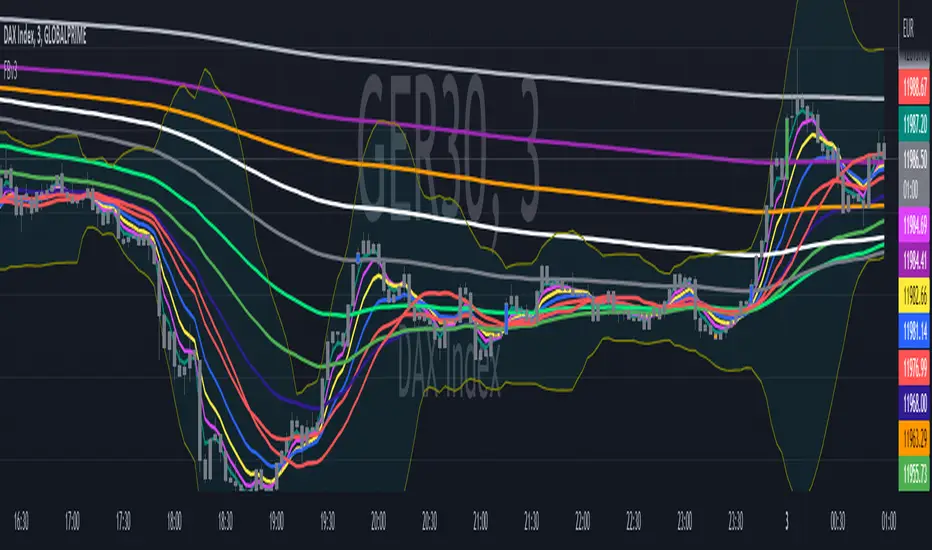
Multi-Timeframe 200 EMAMulti-Timeframe 200 EMA Indicator
This indicator plots five 200-period Exponential Moving Averages (EMAs) on your chart, each from a different timeframe: 1-hour, 2-hour, 4-hour, 8-hour, and 1-day.
What It Does:
Analyzes Higher Timeframes: It uses the request.security() function to fetch data from higher timeframes. This allows you to see significant long-term support and resistance levels from higher timeframes, all on your current chart.
Customizable: You can easily turn each EMA line on or off individually in the indicator's settings. By default, the 1-hour and 1-day EMAs are off, so you can focus on the intermediate timeframes right away.
Clean and Simple: The indicator is designed to be clean and easy to read, with different colors for each EMA line to help you quickly identify the different timeframes at a glance.
This is a powerful tool for trend analysis and identifying key price levels, helping you make more informed trading decisions.

Combo 2/20 EMA & Bandpass Filter by TamarokDescription:
This strategy combines a 2/20 exponential moving average (EMA) crossover with a custom bandpass filter to generate buy and sell signals.
Use the Fast EMA and Slow EMA inputs to adjust trend sensitivity, and the Bandpass Filter Length, Delta, and Zones to fine-tune momentum turns.
Signals occur when both EMA and BPF agree in direction, with optional reversal and time filters.
How to use:
1. Add the script to your chart in TradingView.
2. Adjust the EMA and BP Filter parameters to match your asset’s volatility.
3. Enable ‘Reverse Signals’ to trade counter-trend, or use the time filter to limit sessions.
4. Set alerts on Long Alert and Short Alert for automated notifications.
Inspiration:
Based on HPotter’s original combo strategy (Stocks & Commodities Mar 2010).
Updated to Pine Script v6 with streamlined code and alerts.
WARNING:
For purpose educate only

EMA and MACD with Trailing Stop Loss (by Coinrule)An exponential moving average ( EMA ) is a type of moving average (MA) that places a greater weight and significance on the most recent data points. The exponential moving average is also referred to as the exponentially weighted moving average. An exponentially weighted moving average reacts more significantly to recent price changes than a simple moving average simple moving average ( SMA ), which applies an equal weight to all observations in the period.
Moving average convergence divergence ( MACD ) is a trend-following momentum indicator that shows the relationship between two moving averages of a security’s price. The MACD is calculated by subtracting the 26-period exponential moving average ( EMA ) from the 12-period EMA.
The result of that calculation is the MACD line. A nine-day EMA of the MACD called the "signal line," is then plotted on top of the MACD line, which can function as a trigger for buy and sell signals. Traders may buy the security when the MACD crosses above its signal line and sell—or short—the security when the MACD crosses below the signal line. Moving average convergence divergence ( MACD ) indicators can be interpreted in several ways, but the more common methods are crossovers, divergences, and rapid rises/falls.
The Strategy enters and closes the trade when the following conditions are met:
LONG
The MACD histogram turns bearish
EMA7 is greater than EMA14
EXIT
Price increases 3% trailing
Price decreases 1% trailing
This strategy is back-tested from 1 January 2022 to simulate how the strategy would work in a bear market and provides good returns.
Pairs that produce very strong results include XRPUSDT on the 1-minute timeframe. This short timeframe means that this strategy opens and closes trades regularly
In order to further improve the strategy, the EMA can be changed from 7 and 14 to, say, EMA20 and EMA50. Furthermore, the trailing stop loss can also be changed to ideally suit the user to match their needs.
The strategy assumes each order is using 30% of the available coins to make the results more realistic and to simulate you only ran this strategy on 30% of your holdings. A trading fee of 0.1% is also taken into account and is aligned to the base fee applied on Binance.

Multi-timeframe EMAThe Multi-timeframe exponential moving average (EMA) indicator visualizes EMAs from 1 minute to 1 quarter on a single chart using the request.security function. Standard and Fibonacci timeframes are available as well as the ability to hide high-timeframe EMAs to keep the chart clean. Cross-overs and arrangement of the EMAs indicate sentiment.
Much love to DumpCap! The script is presented sans secret sauce.
Multi EMA with labels (Any timeframe)This script lets you add up to 8 EMAs (Exponential Moving Averages) that can be set to any timeframe and length. The difference between this and other EMA indicators is that it has a simple label attached to each EMA showing which timeframe it belongs to and what length it is, so you can get that information at a glance while trading without having to remember the specific settings for each EMA.
I was personally looking for something like this because I like clarity on my chart and these labels really help. The existing EMA indicators I found with labels don't support multiple timesframes or if they do, they don't include the timeframe itself in the label, so that's why I created this simple script and shared it in case somebody else is looking for the same. Enjoy.

Bitcoin trend RVI and Emastrategy with two emas and rvi.
Only long positions when fast ema above slow ema when rvi gives entry.
Only short positions when slow ema above fast ema when rvi gives entry.

10 EMA StrategyThis indicator shows you:
- The first bullish candle to close below EMA 10
- The first bearish candle to close above EMA 10.
Optional:
You can enable the exit signals in the setting. This will show you:
- If you are long (bullish), it will signal when the first bullish candle closes below EMA 10
- If you are short (bearish), it will signal when the first bearish candle closes above EMA 10
You can also change the EMA 10, to another length, if you want to try something else.

EMA RSI ATR Hidden Div Strat - 1 MinHey there!
Hereby I present you the EMA RSI Lowest Low Hidden Divergence strategy, which I discovered on a youtube channel.
He has tested the strategy hundreds of times manually, herewith I try to automate the whole thing.
Since I use the strategy with a bot, it can only enter long positions for now. But in the future I will add the possibility to trade short positions.
The strategy was tested with BTC/ USDT in 1m chart (8 days). The values must be adjusted depending on the timeframe and coin.
-----------------------------------------------------------------------------------
How does the strategy work?
First of all, we need a bullish hidden divergence.
Once this is detected, the following parameters are checked:
The 50 EMA must cross the 250 EMA .
Then, the candle must close above the 50 EMA .
The K line of the RSI STOCH indicator need to crosses the D line.
If the next candle closes above the 50 EMA , a long position is opened.
The stop loss is determined with the "lowest low/highest high lookback".
The profit factor is multiplied by the value of the lowest low/highest high lookback.
The results of the strategy are without commissions and levers.
If you have any questions or feedback, please let me know in the comments.
In the future I will add other types of stop loss / take profits. (ATR; %; eg.)
I wish you good luck with the strategy!

Phicube EMASAR ( EMA Support and Resistance )Indicator based on the Concept created by Bo Williams. But unlike the original that uses MIMAs, EMAs are used here.
Exponential moving averages will be shown according to fractal alignment, in order to show the important support and resistance levels ( SAR ).
When the fractals are aligned to become support,
we will have the EMA in the graph with a bright color.
When the fractals are aligned to become resistance, we will have EMA in the graph with a matte color.
Available exponential moving averages: 17,34,72,144,305,610,1292 and 2584
____________________________________________________//_____________________________________________________________________
Indicador baseado no Conceito criado pelo Bo Williams. Mas diferente do original que utiliza MIMAs, aqui é utilizado EMAs.
As médias móveis exponenciais serão mostradas de acordo com o alinhamento dos fractais, com objetivo de mostrar os níveis importantes
de suporte e resistência( SAR ).
Quando estiver com os fractais alinhados virando suporte, teremos no gráfico a EMA com uma cor em tom brilhante.
Quando estiver com os fractais alinhados virando resistência, teremos no gráfico a EMA com uma cor em tom fosco.
Médias móveis exponenciais disponíveis: 17,34,72,144,305,610,1292 e 2584
